
Figure 8.
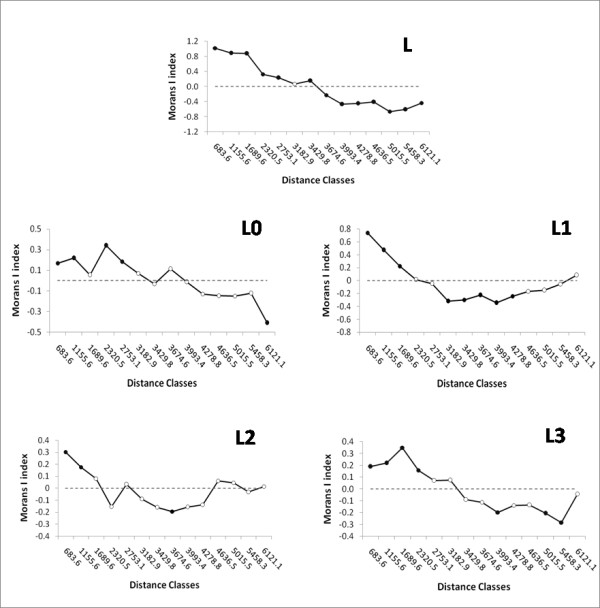
Spatial correlograms of Moran's I indeces for the total L frequency in the populations, and for the L0, L1, L2 and L3 proportions of the sub-Saharan pools in the samples. Geographic distances separating samples are distributed into 14 classes. Full dots represent significant p-values (p < 0.05); empty dots are non-significant p-values.