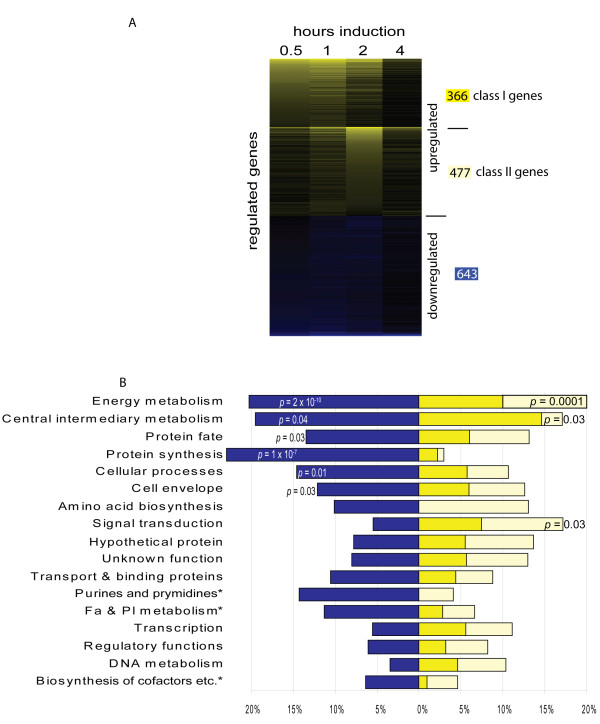
Figure 1.
Twenty percent of the protein coding genes are significantly regulated during glycerol-induced sporulation. A. A heat map displaying average fold-changes of 1 485 genes whose expression is significantly regulated in at least one time point ≥ two-fold above (yellow) or below (blue) vegetative cells at the indicated hours after induction with glycerol. Upregulated genes were first organized into two self-organizing maps of genes whose expression peaks early (class I) and late (class II) and sorted by descending fold induction at 0.5 and 2 hours, respectively. Downregulated genes were sorted by descending fold induction at 0.5 hours. The number of class I and class II upregulated and downregulated genes is indicated to the right according to the colour scheme in B. B. Functional characterization of gene expression patterns. The percent of significantly down- (blue), class I up- (yellow), and class II up- (orange) genes in the listed JCVI main role categories. Role assignments were modified as described in Materials and Methods. *: main role abbreviations: Fa & Pl metabolism: Fatty acid and phospholipid metabolism; Biosynthesis of cofactors etc.: Biosynthesis of cofactors, prosthetic groups, and carriers; Purines and pyrimidines: Purines, pyrimidines, nucleosides, and nucleotides.

