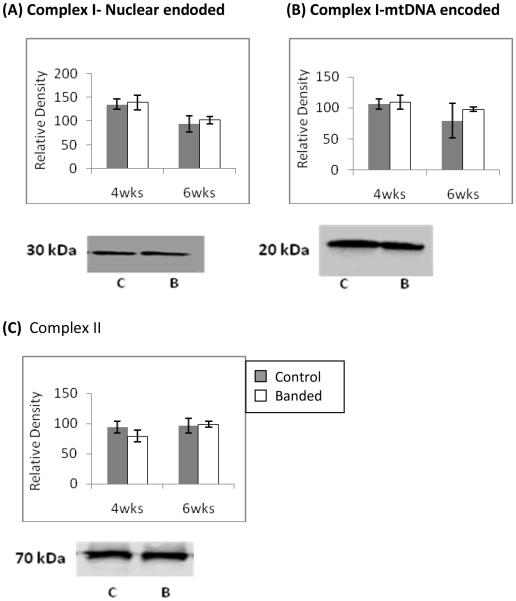
Figure 3.
Western blot analysis of ETC complex subunit protein levels at 4wks and 6wks of age. Representative blots are shown. Nuclear encoded, 30kDa Iron-Sulfur Protein 3 (A) and the mitochondrial encoded 20 kDa, ND6 subunits (B) of complex I are unchanged at both time points. (C) The protein level of the complex II 70 kDa flavoprotein is unchanged change as well. Representative immunobots are shown and bar graphs depict cumulative data which are expressed are as means ± SEM (n=4 *p≤0.05).

