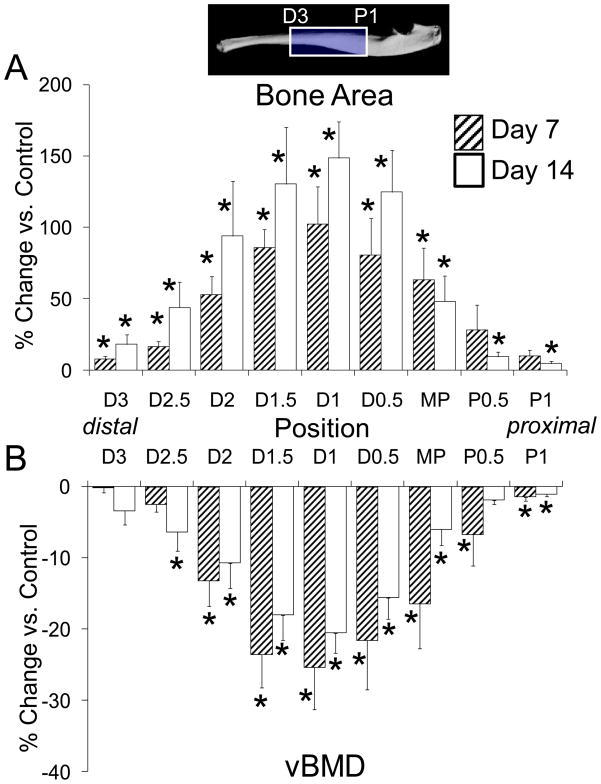
Figure 6.
Change in (A) bone area and (B) volumetric bone mineral density in loaded compared to control ulnae was determined by microCT at nine sections spanning 4 mm of the ulnar diaphysis. The peak increase in bone area was centered at section D1 (1 mm distal to midpoint [MP]), corresponding to the location of fracture, and diminished proximal and distal to this. BMD was decreased in a similar pattern, indicating the addition of lower density woven bone. (mean ± SE)
* loaded different from non-loaded, contralateral control: paired t-test, p < 0.05

