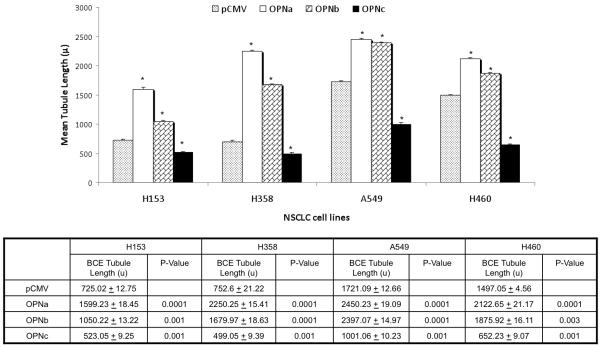
Figure 4a.
Bar graft depicting the effect of the overexpression of individual OPN isoforms compared to pCMV empty vector controls on mean BCE tubule length (μ) in four NSCLC cell lines. Asterisk denotes a significant difference between OPN isoform overexpression in cell lines and pCMV controls. Mean tubule length ± standard deviation and p-value are listed below bar graft. H153 and H358 wild type cells had significantly shorter BCE tubule lengths than A549 and H460, which have high native OPN expression. Tubule formation was significantly increased in all cell lines with forced overexpression of OPNa and OPNb compared to controls. Conversely, overexpression of OPNc resulted in significantly fewer tubules formed compared to controls in all cell lines.

