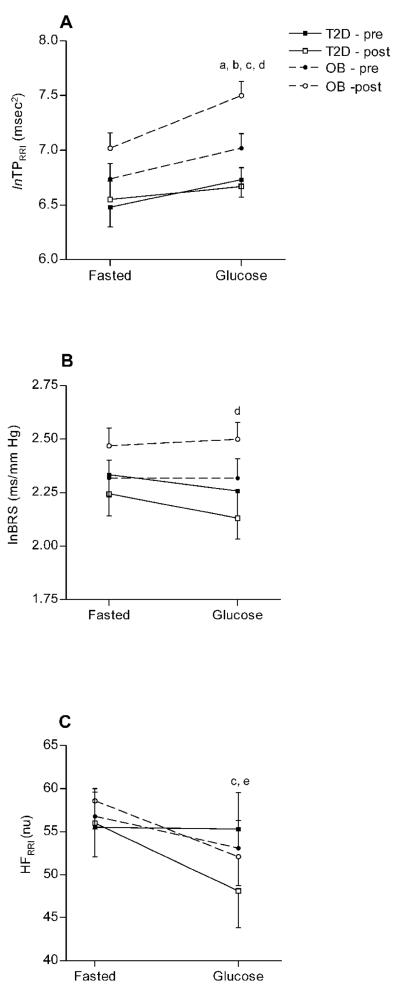
Figure 1A-C.
Total power (lnTPRRI, Figure 1A), baroreflex sensitivity (lnBRS, Figure 1B), and high frequency (HFRRI, Figure 1C) responses (means ± SE) to glucose ingestion before and after exercise training. All values are presented as natural logarithms (ln). ap<0.05, pre- vs. post training; bp<0.05, OB vs. T2D; cp<0.05, fasted vs. glucose loaded; dp<0.05, time by group interaction; ep<0.05, time by metabolic status interaction

