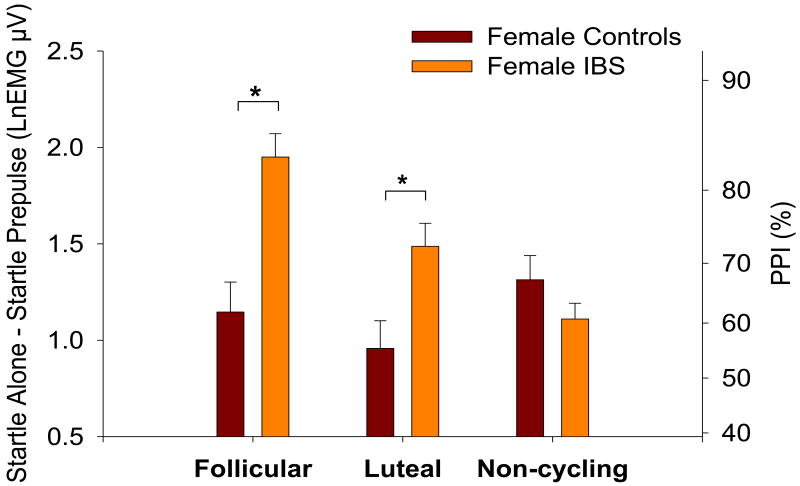
Figure 4.
Prepulse inhibition of the acoustic startle response within each menstrual group. Values are the estimated difference between mean Startle Alone and Prepulse trials (with standard error bars). Increased prepulse inhibition is indicated by an increased difference (positive axis). The right axes shows percent change derived from the log-transformed values. Significance is indicated for diagnosis differences within each menstrual group. LnEMG μV = natural log transformed microvolts.

