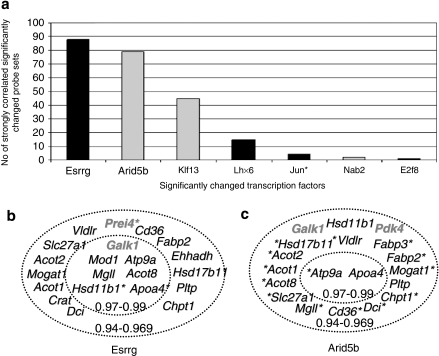
Figure 4.
(a) Significantly changed transcription factor genes and their correlation coefficient (CC >0.94) with other significantly changed genes (>2-fold change, 0% false discovery rate) that are shown in Supplementary Table 2. The gene expression patterns of Esrrg and Arid5b had high CC to the largest numbers of other significantly changed genes. Black bars indicate positive and gray bars indicate negative correlation. (b) Correlation of the expression of Esrrg with several genes of lipid metabolism and few genes of carbohydrate metabolism. All negative correlations are marked with asterisks (*). Genes with the highest (0.97–0.99) CCs are presented in the inner circle. (c) Correlation of the expression of Arid5b with several genes of lipid metabolism and few genes of carbohydrate metabolism. Note that several genes of panels b and c correlate positively with Esrrg and negatively with Arid5b. All negative correlations are marked with asterisks (*). Genes with the highest (0.97–0.99) correlation coefficients are presented in the inner circle. In both panels b and c, genes related to carbohydrate metabolism appear in gray color.

