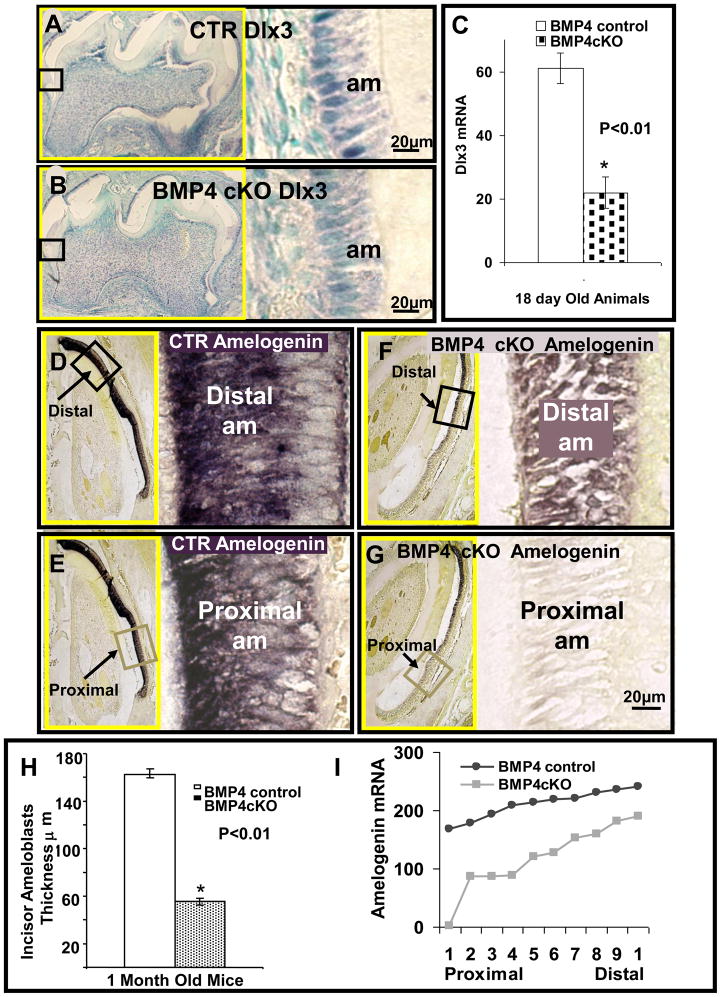
Fig. 7.
Figure 7 shows in situ hybridization of Dlx3 (A–C) and Amelogenin (D–G and I) in ameloblasts of control (A, D, E) and BMP4 cKO (B, F, G) mice. An example of the hybridization signal for Dlx3 is shown in Figure A and B for one set of CTR and BMP4 cKO animals, with quantitation from this example shown in Figure 7C from multiple sections. Similar results have been seen with an independent set of CTR and BMP4 cKO animals of similar age (data not shown). Representative sections for Dlx3 were from molars (A, B) and for Amelogenin from incisors (D–G), in 18–30 day old mice. The expressions of Dlx3 mRNA in control mice (A) are reduced in BMP4 cKO (B) mice by 64% (C) in this example. Amelogenin mRNA hybridization signal (tones of dark purple to black color) in control ameloblasts (D, E) is higher on average 59% (I) as compared to BMP4 cKO ameloblasts (F, G). In control mice, expression of Amelogenin mRNA of proximal less mature incisor ameloblasts is 27% lower (E) from more mature distal ameloblasts (D). In BMP4 cKO mice, expression of Amelogenin mRNA in proximal incisor ameloblasts is barely detectable (G) compared to distal incisor ameloblasts (F). Distal expression of Amelogenin in control mice (D) is increased by 58% compared to BMP4 cKO mice (F, I) in this example. Proximal expression of Amelogenin in BMP4 cKO mice (G) decreased to an undetectable level compared to control mice (E, I). A similar incisor gradient of Amelogenin expression was observed in an independent set of animals of similar age. Ameloblast (am) thickness in incisors was also reduced by 65% in BMP4 cKO mice compared to the control mice (H), as determined in this set of CTR and BMP4 cKO animals. On the left side of A, B and D–G, surrounded with yellow frame is the smaller magnification of each picture which contains the smaller boxed area representing positions and origins of higher magnifications shown on the right side.

