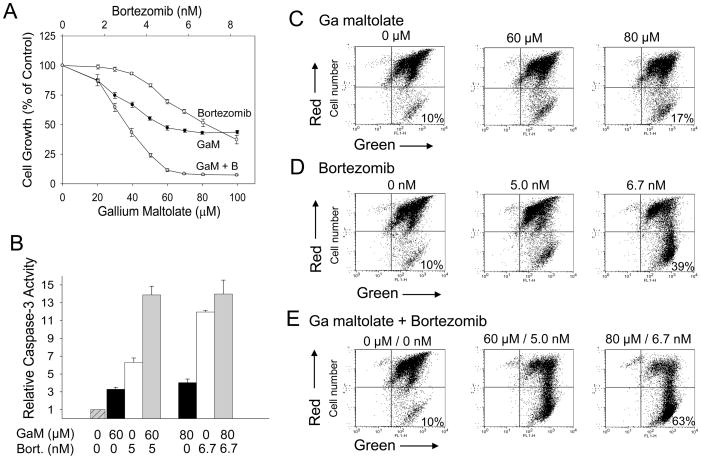
Figure 1. Bortezomib synergistically enhances gallium maltolate-induced cell in mantle cell lymphoma cells.
A. Cell proliferation. Granta cells were plated in a 96-well plate (0.2 × 10⁶ cells/ml) in the presence of increasing concentrations of gallium maltolate (GaM), bortezomib, or both drugs in combination at a fix molar ratio. Cell growth was measured by MTT assay after a 48-h incubation. Values shown represent means ± S.E. (n = 3). GaM, gallium maltolate; B, bortezomib. B. Caspase 3 activity. Granta cells incubated with increasing concentrations of gallium maltolate (GaM, black bar), bortezomib (Bort, white bar), or both drugs in combination (gray bar) were analyzed for caspase-3 activity after a 24 h incubation. Values shown are the means ± S.E. of a representative experiment performed in triplicate. C – E. Mitochondrial membrane permeability. Granta cells were analyzed by JC-1 staining after incubation with gallium maltolate (C), bortezomib (D), or both agents (E) for 24 h as described in Materials and Methods. A loss of mitochondrial membrane potential (increase in membrane permeability) results a decrease in mitochondrial red fluorescence (represented in the upper right quadrant on dot plot) and an increase in cytoplasmic green fluorescence (represented in the lower right quadrant on dot plot). The percentage of cells with green fluorescence is shown.

