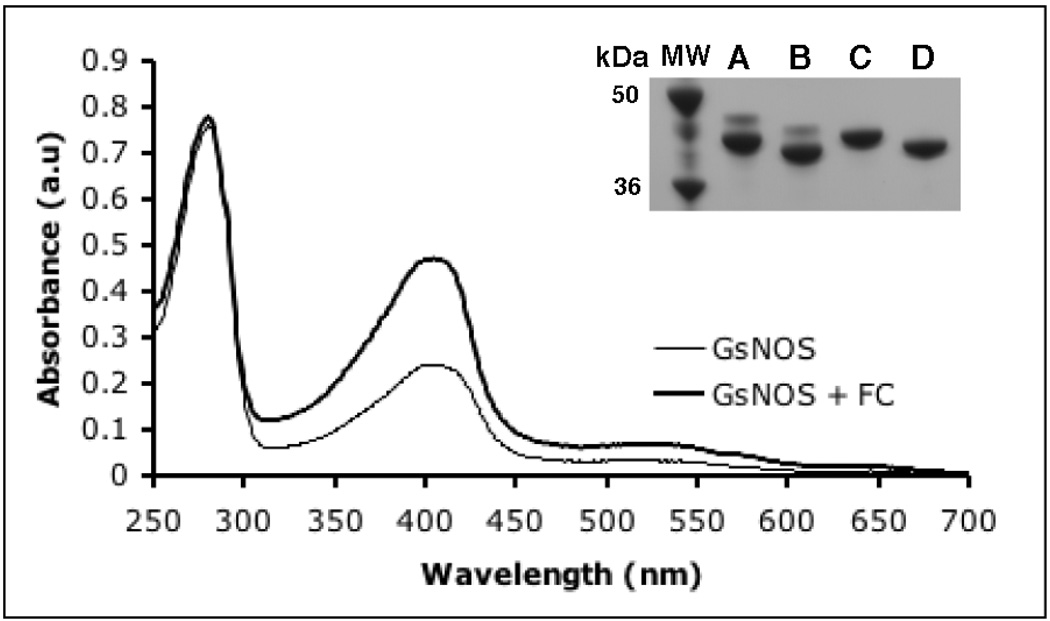
Fig 1.
UV-Vis spectra of gsNOS expressed alone (thin line) and gsNOS expressed with FC (thick line). Co-expression of FC results in a substantial increase in heme content of gsNOS as measured by the Abs403/Abs280 ratio. This value saturates at 0.6, which indicates nearly complete heme incorporation. Inset: GsNOS expressed by itself results in two bands on SDS-PAGE (lane A), both of which shift on His-tag cleavage (lane B). GsNOS co-expressed with FC results in just one band (lane C), that shifts on His-tag cleavage (lane D) as expected.

