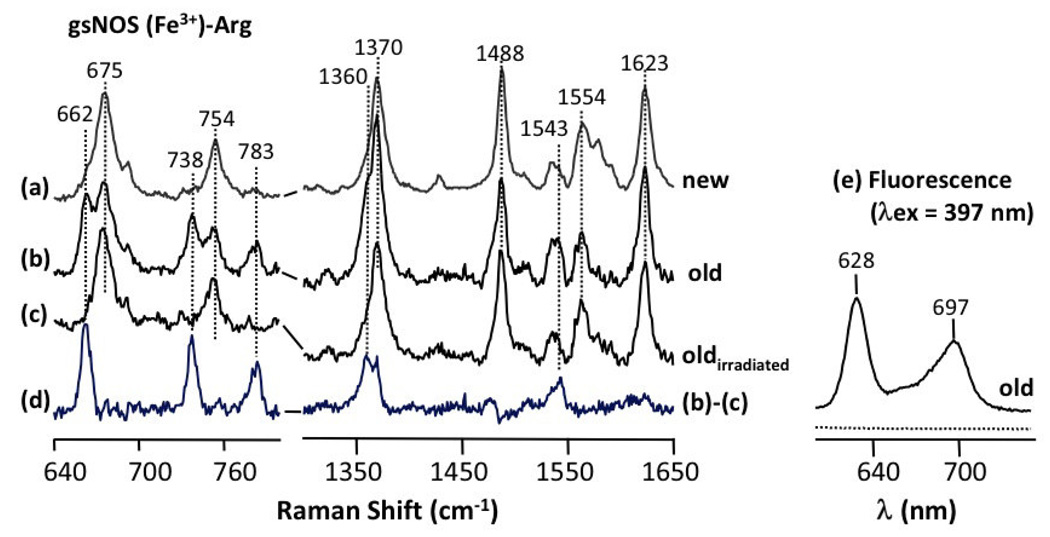
Fig 2.
Resonance Raman spectra of gsNOS from gsNOS co-expressed with FC (a), gsNOS expressed by itself (b) and (c). The spectrum in (b) is obtained with 3 mW of 413.1 nm laser excitation with an acquisition time of 5 min. The spectrum in (c) is for the same sample as (b), but obtained after prolonged irradiation with 42 mW of 413.1 nm laser for two hours. (d) shows the difference spectrum (b) – (c), which highlights spectral lines resulting from contamination by photosensitive protoporphyrin IX. The fluorescence spectrum in (e) obtained after a 397 nm excitation is representative of that of protoporphyrin IX bound to protein (see text) and is from same sample in (b).

