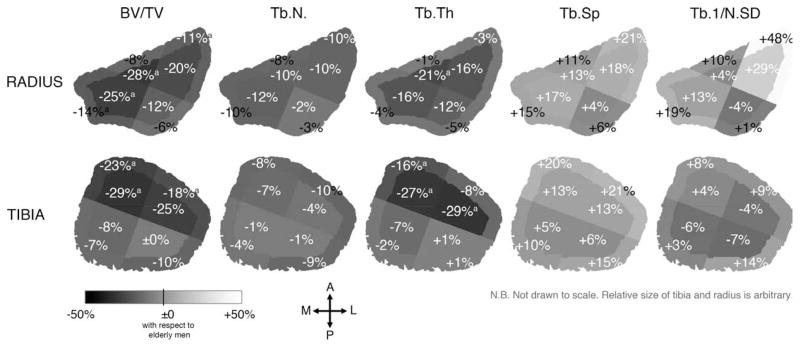
Figure 4.
The mean percent difference in the trabecular structure indices for elderly women (N = 13) compared to elderly men (N = 9) in each subregion at the distal radius (top) and tibia (bottom). Significant difference from elderly men with a p < 0.05; b p < 0.01; c p < 0.001 using Mann-Whitney U test.

