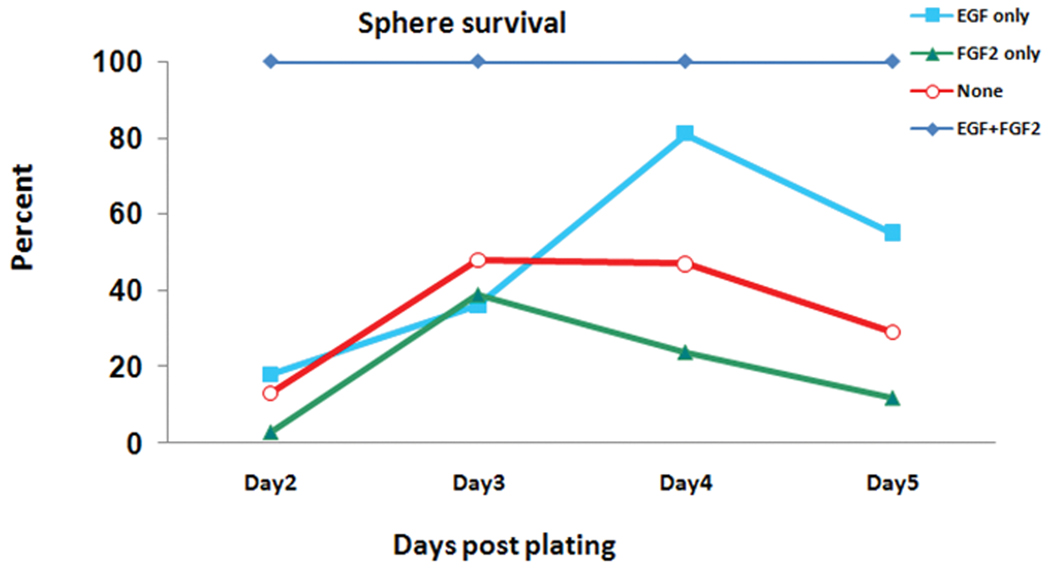
Figure 4. E10 cells grow best in the presence of both EGF and FGF2.
Daily counts of viable cells using trypan blue in the presence of either EGF or FGF2, both or none. 107 E10 cells were plated on day 1. Exposure of cells to EGF, FGF2 or none resulted in lower number of spheres compared with the group exposed to both growth factors. Data are presented as percent of living spheres compared to both EGF and FGF2 (the 100% line). EGF, epidermal growth factor; FGF2, basic fibroblast growth factor. The line representing EGF+FGF is an average of three derivations; all other lines represent percentage survival of only one derivation (not an average).

