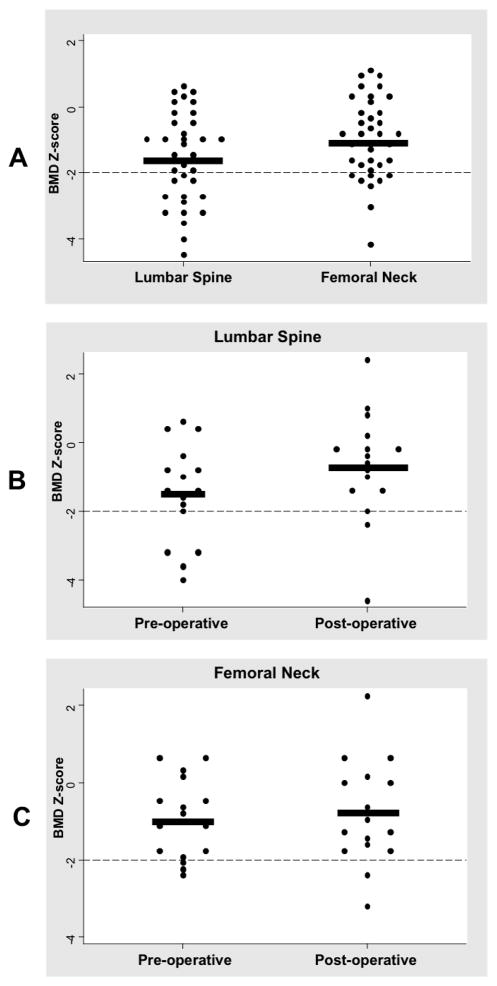
Figure 1.
A, Distributional plot for pre-operative lumbar spine and femoral neck BMD Z-scores. Dashed line is at the −2.00 level. Thick black line represents the means (−1.60 ± 1.37 vs. −1.04 ± 1.19, p=0.003). B, Distributional plot for lumbar spine BMD z-scores at baseline and follow up. Delta of 0.84 ± 0.88 (p=0.002). C, Distributional plot for femoral neck BMD z-scores at baseline and follow-up. Delta of 0.15 ± 0.62 (p=0.335).

