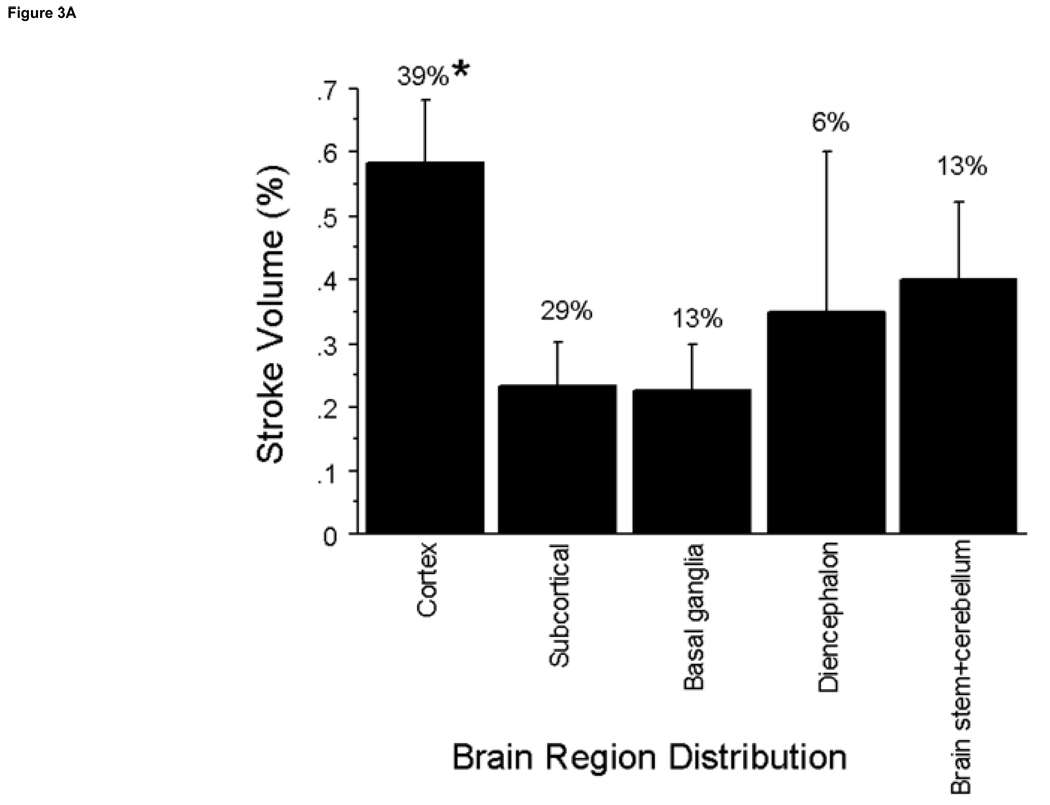
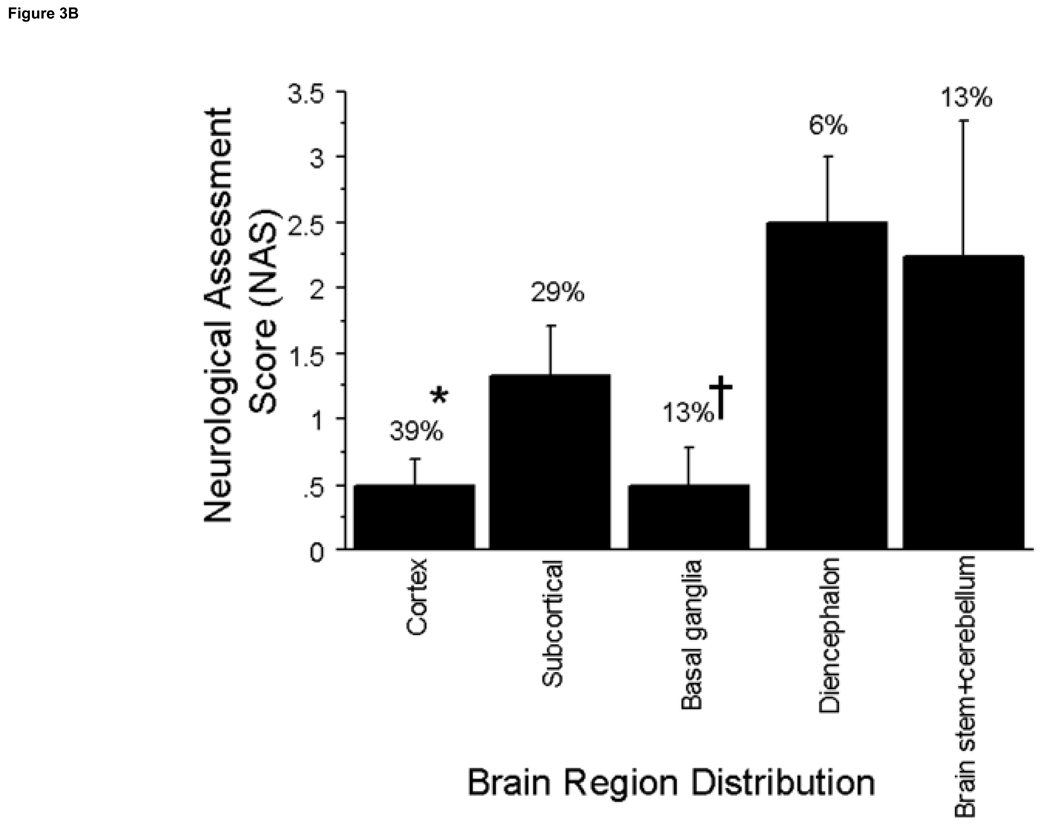
Figure 3. Regional Distribution of Stroke Volume and NAS.
A. The incidence of stroke in brain regions was determined. ANOVA analysis indicates significant differences between stroke volumes in the cortex compared to the subcortical, and basal ganglia regions at (P≤0.03) with the greatest volume and percent distribution occurring in the cortex. B. The brain regions with the highest incidence of neurological deficits were the cortex and subcortical regions. The brain regions with the highest neurological deficits were the diencephalon and the brainstem + cerebellum which were significantly higher in neurological deficits vs. the cortex at *P≤0.02 and vs. the basal ganglia at †P≤0.04.


