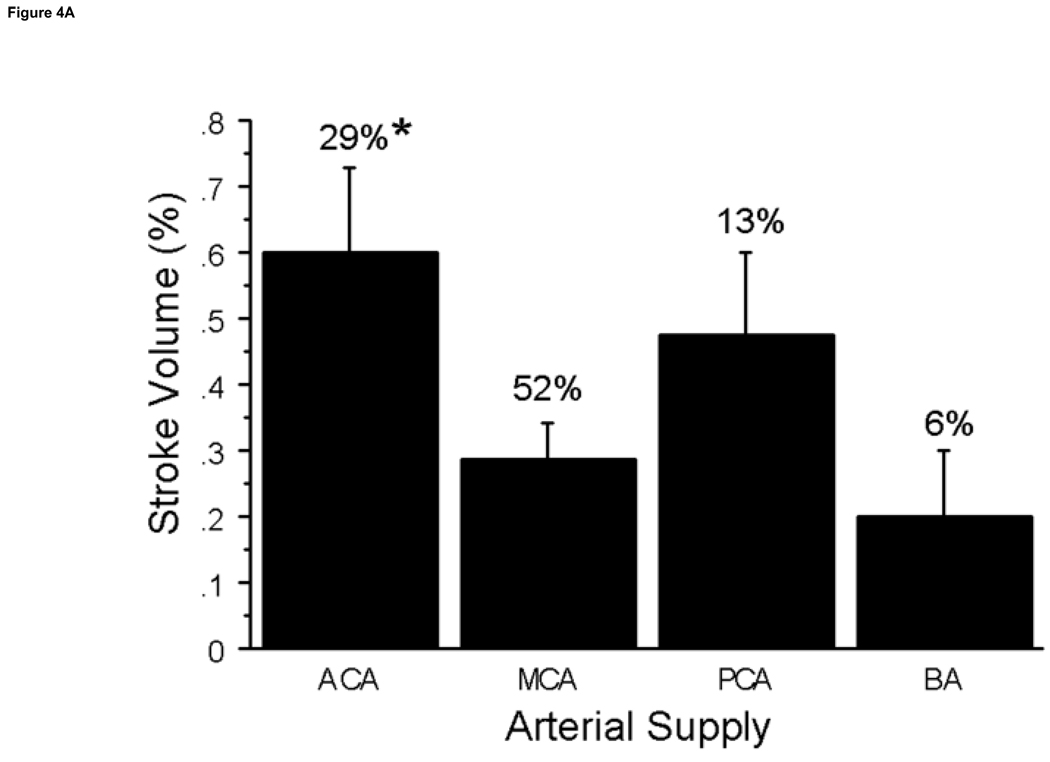
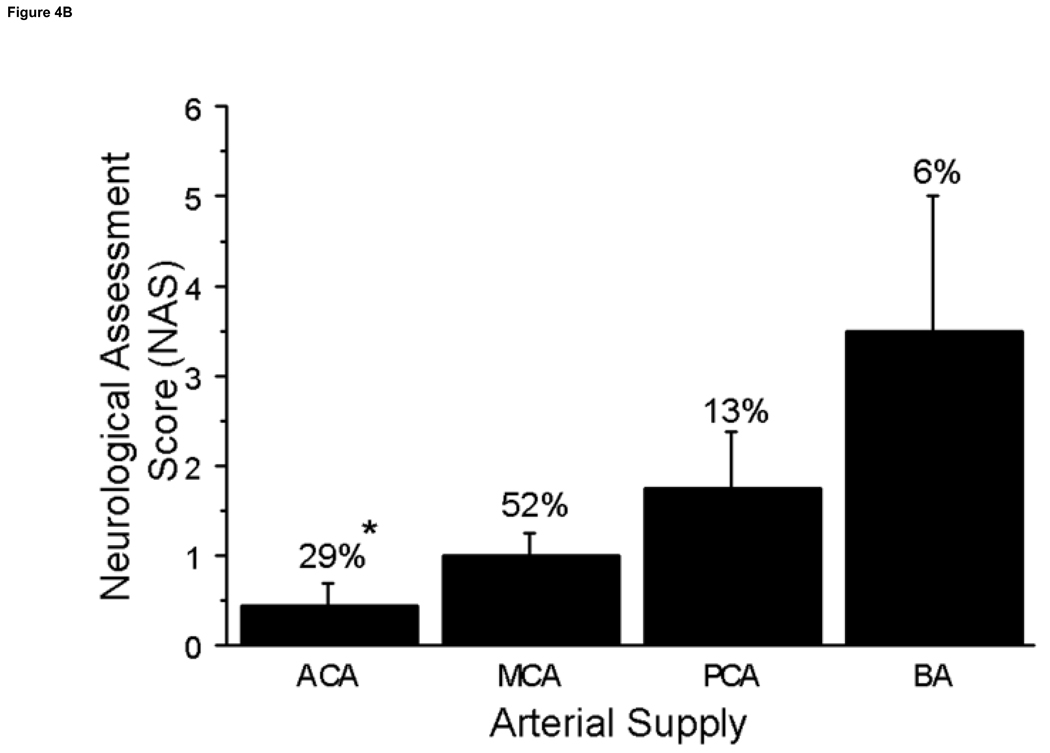
Figure 4. Arterial Supply of Stroke Volume and NAS.
A. The incidence of stroke in the perfusion territories of the major cerebral arteries was determined with the greatest percentage occurrence in the MCA at 52%. Whereas the ACA had a lower incidence of stroke, it also had the greater stroke volume compared to the MCA territory at *P=0.01. B. The NAS are presented by arterial territory and percent of stroke incidence. The arterial territories with the greatest incidence were the ACA and MCA however NAS values were very low. The PCA and BA had the higher NAS values vs. the ACA at *P≤0.04. Abbreviations: Anterior Cerebral Artery (ACA), Middle Cerebral Artery (MCA), Posterior Cerebral Artery (PCA) and Basilar Artery (BA).


