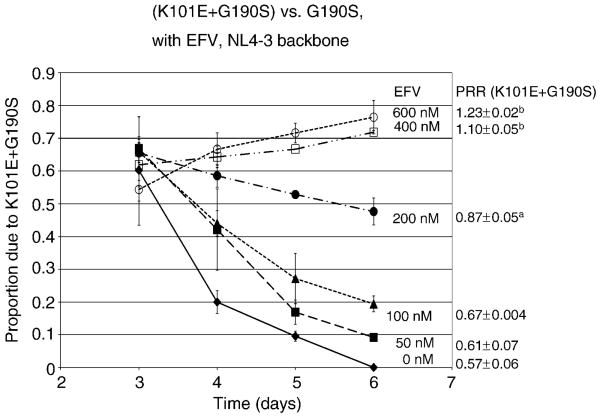
Figure 1. Relative replication fitness of K101E+G190S, in an NL4-3 backbone, in the absence and presence of EFV.
The graph represents the relative proportion of the double mutant K101E+G190S relative to the reference strain G190S NL4-3, as determined by bulk sequence analysis in growth competition experiments, as outlined in Materials and Methods. Growth competition experiments were performed in the absence of EFV (closed diamonds), or in the presence of 50 nM (closed squares), 100 nM (closed triangles), 200 nM (closed circles), 400 nM (open squares), or 600 nM (open circles) of EFV. Data represent the mean and standard deviation of results from a minimum of three independent infections. The average and standard deviation of the production rate ratio (PRR) at each EFV concentration is shown to the left of the graph. ap=0.007 and bp<0.001 compared to PRR in absence of EFV. EFV, EFV.

