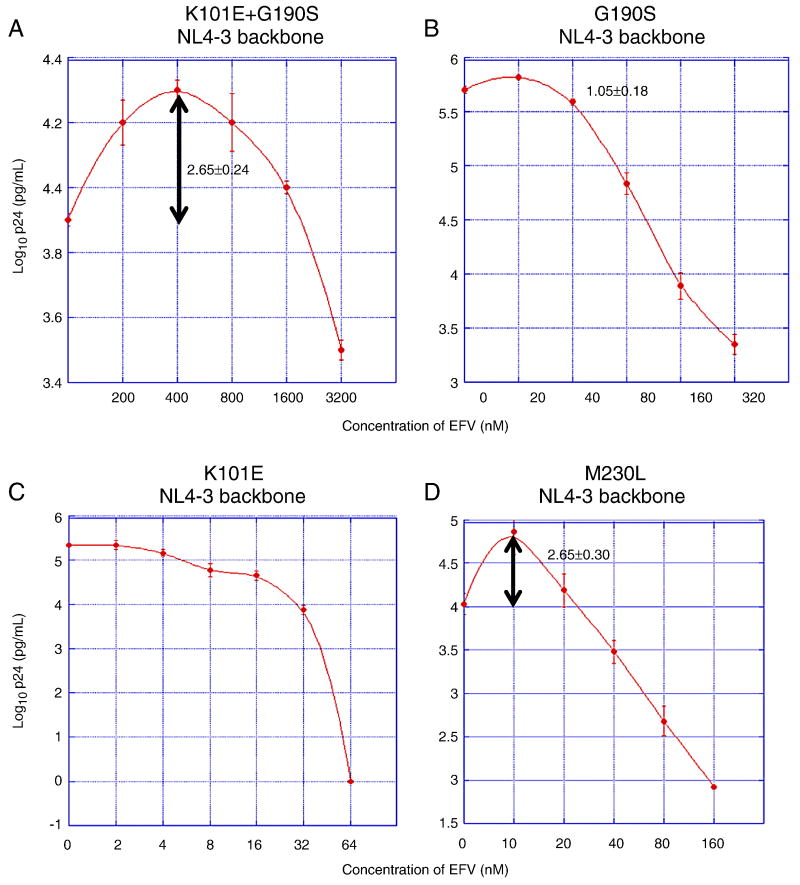
Figure 2. EFV susceptibilities of NNRTI-resistant mutants of NL4-3.
Graphs represent the results of EFV susceptibility assays of the NNRTI-resistant mutants K101E+G190S (panel A), G190S (panel B), K101E (panel C), and M230L (panel D). Each mutant was introduced into an NL4-3 RT backbone. X-axis represents time after infection; y-axis represents virus replication, expressed as log10 p24 antigen concentration in culture supernatant. The peak fold increases in p24 concentration compared to the p24 concentration without drug is noted on each graph at the appropriate EFV concentration. Note that the scales of the x- and y-axes differ for each mutant. Data points represent the mean and standard deviation of at least three independent infections. For K101E no increase in mean p24 antigen concentration relative to the no-drug control was observed at any of the EFV concentrations tested. For G190S, p24 concentrations of some replicate cultures of the G190S mutant in 20 nM EFV appeared to be higher than the no-drub control, however, this apparent different was not statistically significant (95% confidence intervals cross 1.00).

