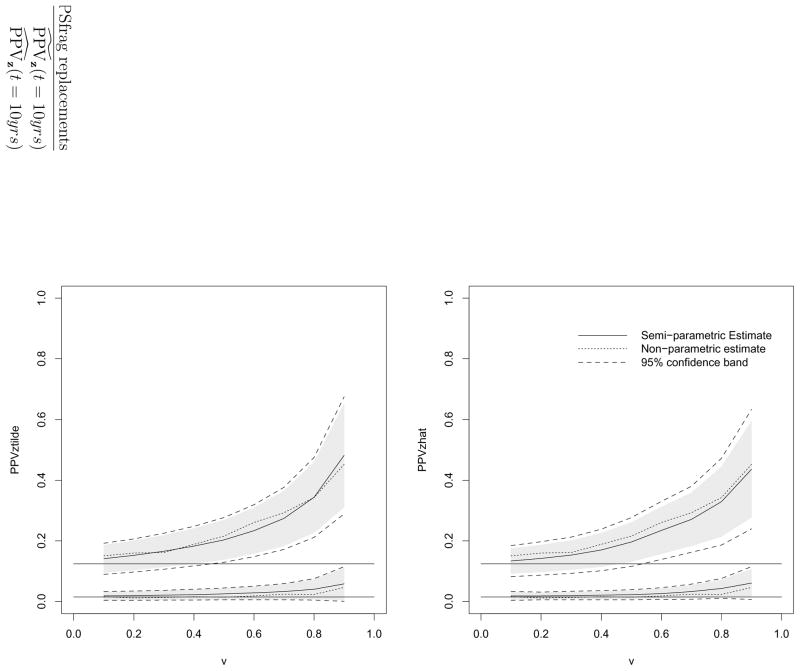
Figure 2.
Estimated PPV curves (left panel: ; right panel: ) and 95% confidence intervals and bands for v ∈ (0.10, 0.90) and at t = 10 years after diagnosis in PC study. Solid lines: estimates of PPVz(t, v); dotted lines: nonparametric estimators of crude PPV(t, v). Dashed lines: 95% simultaneous confidence bands. Shaded areas: 95% confidence intervals. The horizontal lines correspond to the marginal event time probabilities P(T < 10 years|low grade) and P(T < 10 years|moderate to high grade).

