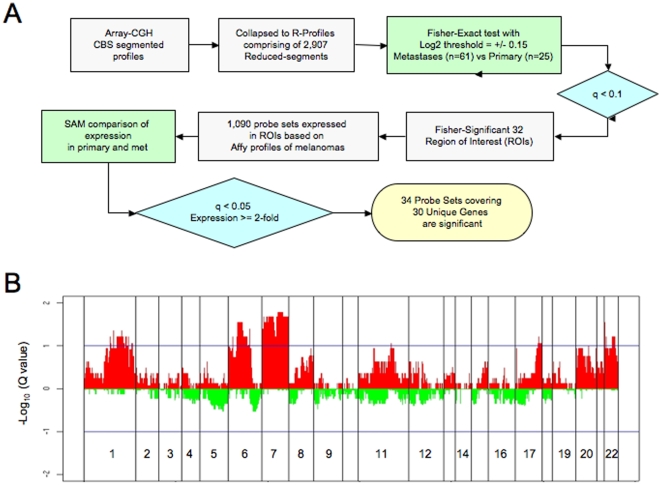
Figure 2. Integrative genomics identify high-confidence metastasis candidate melanoma genes.
(A) Flow chart of integrating copy number and expression analysis to compare primary and metastastic melanoma genomes. (B) Whole genome q-value profiles based on Fisher's Exact Test between primary and metastastic melanomas. X axis coordinates represent genomic map position and Y axis indicates q-value log10 of Fisher's Exact Test between primary and metastastic melanomas at each R-segment.

