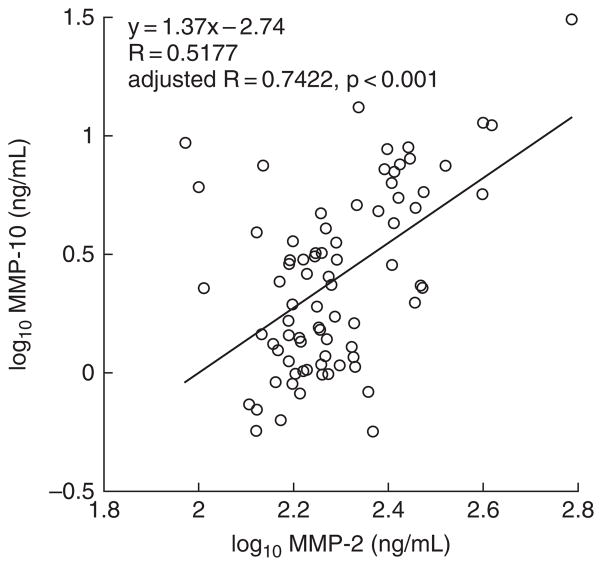
Figure 2.
Correlation of plasma MMP-2 and MMP-10. Correlation analysis controlled for age, sex, and biogeographical ancestry revealed a statistically significant positive correlation (adjusted R = 0.7422, p < 0.001) between plasma MMP-2 and MMP-10 in the set of normotensive, hypertensive, and hypertensive-ESRD subjects. The log10 transformed values for unadjusted plasma MMP-2 and MMP-10 in each subject are displayed in the scatterplot.

