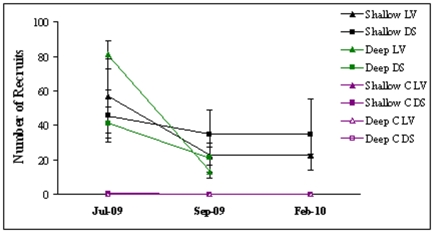
Figure 8. Variations in recruitment patterns between shallow and deep areas of the habitat:
Average densities (±1SE, n = 5 plots of 30×30 cm) of C. barbata recruits in experimental plots at La Vela (LV-triangles) and Due Sorelle (DS-squares) from July 2009 to February 2010. Plots were either cleared in shallow areas (2.5 m depth, black), were canopies of C. barbata are present, or cleared in deeper areas (5 m depth, green), where no canopies are normally found. There were un-manipulated control plots (C-purple) at both depth and sites, but all had virtually no recruits and thus the points in the graph overlap.

