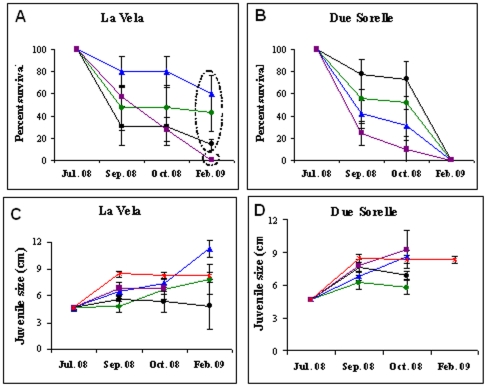
Figure 9. Results from the transplantation experiments:
A.–B. Average percent Survival and C.–D. average Size of C. barbata juveniles transplanted at each study site from July 2008 to February 2009. Treatments were transplanted to: horizontal substrata surrounded by adults (green), horizontal substrata without adults (black), vertical substrata without adults (blue) and original unstable control substrata (purple). Data are averages ±1 SE (n = 4 plots for survival, in each plot n = 5 juveniles initially and thereon the number varied depending on the number of surviving juveniles). Superimposed circles represent results of SNK test for survival data at Feb. 09 in La Vela. Size of natural (non-transplanted, n = 80) recruits at each site is also presented (red). As all plots at Due Sorelle were destroyed by the last monitoring point due to storms, thus size data for this site are presented only until Oct 08.

