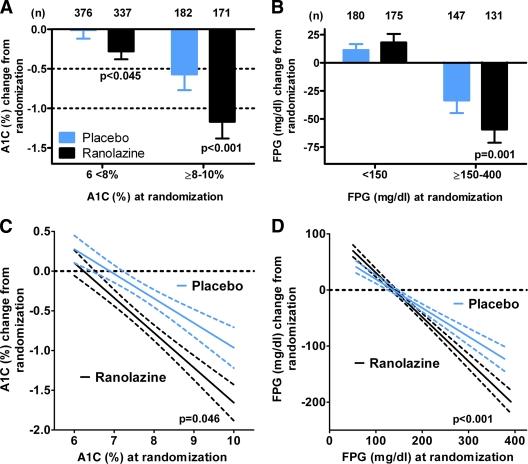
Figure 1.
Relationship between glycemia at randomization and lowering of A1C and FPG by ranolazine in patients with a history of diabetes. A: In a cell means model, with parameters for combinations of treatment, A1C category, and diabetes, the placebo-adjusted effect of ranolazine on A1C was −0.28% (95% CI −0.55 to 0.003, P = 0.045) for patients with A1C 6 to <8% and −0.59% (−0.99 to −0.20, P < 0.001) for patients with A1C ≥8–10%. B: In a cell means model, with parameters for combinations of treatment, FPG category, and diabetes, the placebo-adjusted effect on FPG for these patients was 6.8 mg/dl (95% CI −8.8 to 22.3, P = 0.677) for patients with FPG <150 mg/dl and −25.7 mg/dl (−43.3 to −8.1, P = 0.001) for patients with FPG ≥150–400 mg/dl. Changes in A1C and FPG at month 4 are summarized by mean, associated 95% CI, and number of patients (n). C: Relationship between A1C at randomization and the change in A1C at month 4. The slope for placebo was −0.31 (95% CI −0.41 to −0.21), R = 0.26 and n = 558. For ranolazine, the slope was −0.44 (−0.53 to −0.36), R = 0.41 and n = 508. The slopes were significantly different (P = 0.045). D: Relationship between FPG at randomization and the change in FPG at month 4. The slope for placebo was −0.55 (95% CI −0.64 to −0.46), R = 0.54 and n = 328. For ranolazine, the slope was −0.81 (−0.89 to −0.73), R = 0.76 and n = 310. The slopes were significantly different (P < 0.001). Least squares regression was performed by Graphpad Prism 5.0, and the best-fit line and 95% CI for the fit are shown for each group. Similar results were obtained using an ANCOVA model with a term for treatment, A1C or FPG at randomization, and the interaction of treatment.

