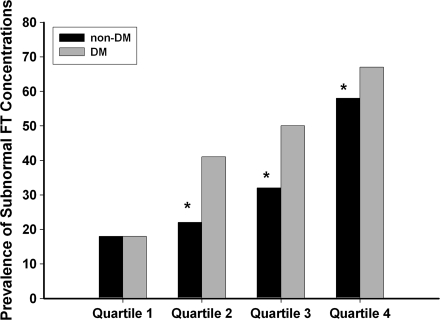
Figure 1.
The prevalence of subnormal free testosterone (FT) concentrations in diabetic (DM,  ) and nondiabetic (non-DM, ■) men separated into quartiles of age. Quartile 1 (aged 45–52 years) had 408 nondiabetic and 55 diabetic men. Quartile 2 (aged 53–59 years) had 378 nondiabetic and 82 diabetic men. Quartile 3 (aged 60–68 years) had 326 nondiabetic and 136 diabetic men. Quartile 4 (aged 69–91 years) had 339 nondiabetic and 125 diabetic men. The prevalence of subnormal free testosterone concentrations was calculated in each quartile for nondiabetic and diabetic men. The prevalence was then adjusted to the mean BMI (29.7 kg/m2) of the whole study population. A χ2 test was used to compare the prevalence among groups. A similar percentage of nondiabetic and diabetic men in quartile 1 had subnormal free testosterone (18 vs. 18%, P = 0.97). Nondiabetic men had a lower prevalence of subnormal free testosterone than diabetic men in the other three quartiles (quartile 2, 22 vs. 41%, P < 0.01; quartile 3, 32 vs. 50%, P < 0.01; and quartile 4, 58 vs. 67%, P = 0.05).

