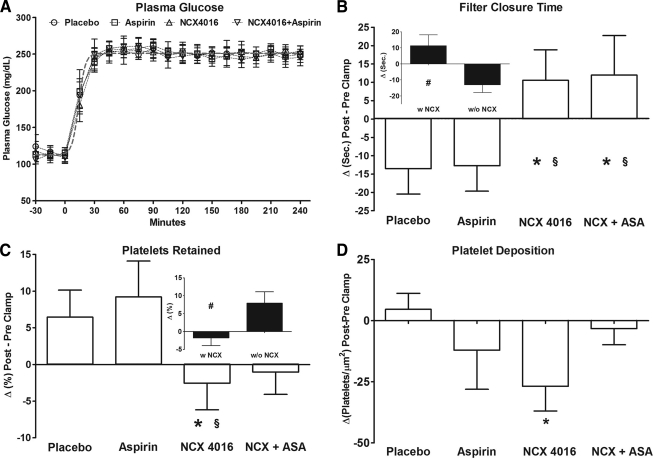
Figure 1.
A: Plasma glucose concentrations before and during the 4-h hyperglycemic clamp in the four treatment groups. No differences between groups were observed at any of the observation times. B and C: Shear stress–induced platelet activation using the O'Brien filtration test. Data are expressed as differences (Δ) between the values observed after the 4-h hyperglycemic clamp (post) and the values observed before (pre). B: Filter closure time expressed in seconds. C: Platelets retained between 20 and 40 s, expressed as a percentage of the platelet count before filtration. In the insets are reported results cumulating the two groups receiving NCX 4016 (w NCX) and the two groups not receiving it (w/o NCX). Data are expressed as means ± SEM. *P < 0.05 vs. placebo; §P < 0.05 vs. aspirin (ASA); #P < 0.05 vs. w/o NCX 4016. D: Platelet deposition on a collagen-coated surface under high shear rate (3,000 s−1). Data are expressed as differences (Δ) between the values observed after the 4-h hyperglycemic clamp (post) and the values observed before (pre). *P < 0.001 versus placebo.

