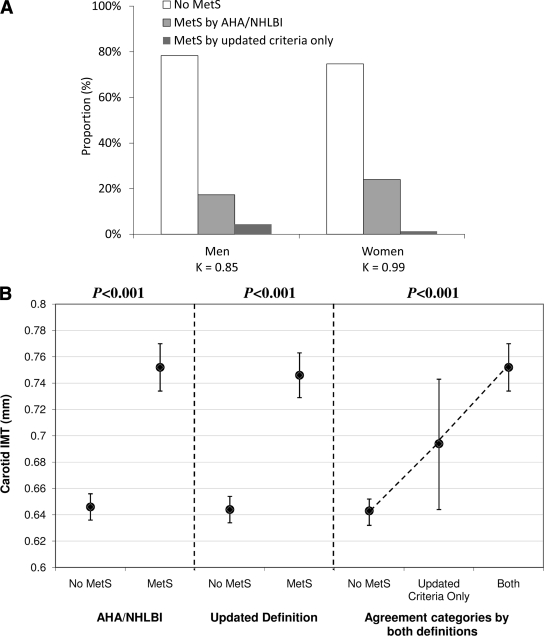
Figure 1.
Prevalence of different categories of agreement between updated and AHA/NHLBI MetS definitions in men (n = 723) and women (n = 662) (A) and mean cIMT in subjects with and without MetS according to the original AHA/NHLBI definition and the updated definition (B). B: The left panel shows mean cIMT among subjects with (n = 401) and without (n = 984) MetS according to the original AHA/NHLBI definition. The middle panel shows the mean cIMT among subjects with (n = 444) and without (n = 941) MetS according to the updated MetS definition. The right panel shows mean cIMT among subjects who do not meet the MetS criteria by any definition (“No MetS,” left bar; n = 941), those who meet the updated criteria but not the original AHA/NHLBI criteria (“Updated Criteria Only,” middle bar; n = 43) and those who meet the MetS criteria by both definitions (“Both,” right bar; n = 401). Point estimates and 95% CIs (bars) are shown. All comparisons are adjusted for sex.

