
Figure 3.
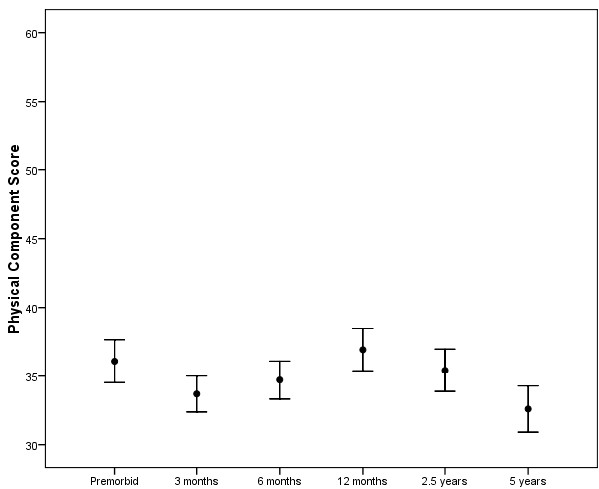
Differences in physical component score between time points for all study patients. The mean score at each stage is plotted with the bars representing one standard error. The means at three months and five years are significantly lower than the mean at the pre-morbid point (P = 0.003 and 0.024, respectively), but means at the other three time points are not significantly different from pre-morbid. The physical component score falls from 2.5 to 5 years (P = 0.002).