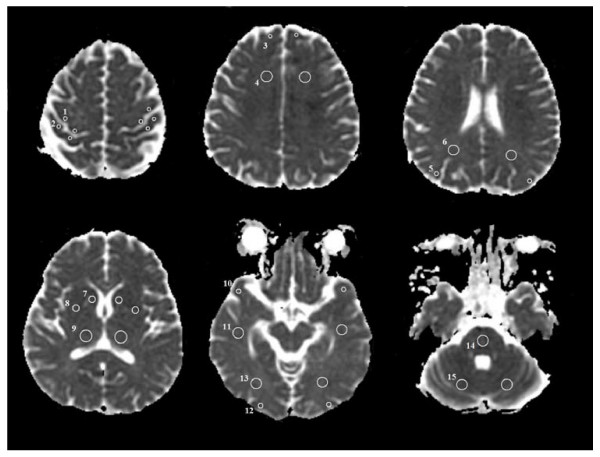
Figure 1.
This figure shows the axial apparent diffusion coefficient maps indicating the 15 regions of interest. These regions were selected for quantitative measurement of the apparent diffusion coefficient values. (1) precentral cortex, (2) postcentral cortex, (3) frontal cortex, (4) frontal white matter, (5) parietal cortex, (6) parietal white matter, (7) caudate nucleus, (8) putamen, (9) thalamus, (10) temporal cortex, (11) temporal white matter, (12) occipital cortex, (13) occipital white matter, (14) pons, and (15) cerebellum.

