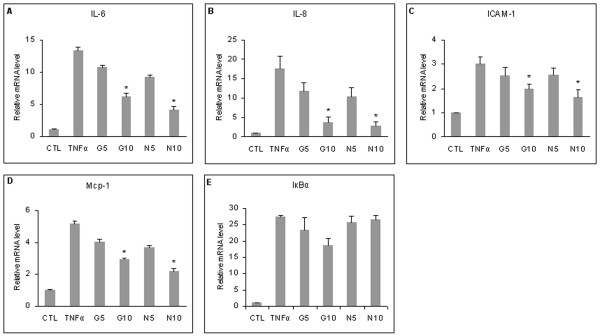
Figure 1.
Effect of glucosamine (GlcN) and NAPA on mRNA expression level in HTB-94 cells. Cells were untreated (CTL), treated with tumor necrosis factor-alpha (TNFα) or pre-treated with 5 and 10 mM GlcN (G5 and G10) or NAPA (N5 and N10) and then stimulated with TNFα for 1 hour. The mRNA was extracted and analyzed by quantitative real-time polymerase chain reaction (Q-RT-PCR). The mRNA levels of IL-6, IL-8, ICAM-1, Mcp-1 and IκBα are shown in (a), (b), (c), (d) and (e), respectively. *P ≤ 0.05. Q-RT-PCR results are expressed as relative mRNA level. Results represent the mean ± standard error of the mean of data obtained by three independent experiments. NAPA, 2-(N-Acetyl)-L-phenylalanylamido-2-deoxy-β-D-glucose.

