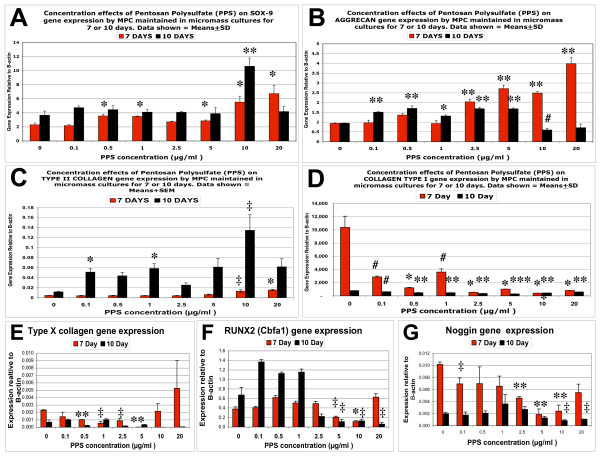
Figure 7.
Effects of pentosan polysulfate on gene expression by mesenchymal precursor stem cells in micromass cultures. Bar graphs showing the concentration effects of pentosan polysulfate (PPS) on (a) SOX-9, (b) Aggrecan, (c) collagen type II, (d) collagen type I, (e) collagen type X, (f) RUNX2 (Cbfa1) and (g) Noggin gene expression by mesenchymal precursor stem cells (MPCs) in micromass cultures for 7 and 10 days as determined by real-time quantitative PCR. n = 3 for each PPS concentration. Data expressed as mean ± standard deviation for each PPS concentration after normalising for the expression of the housekeeping gene, β-actin. #P < 0.05, *P < 0.01, **P < 0.001, ***P < 0.0001 gene expression relative to control.

