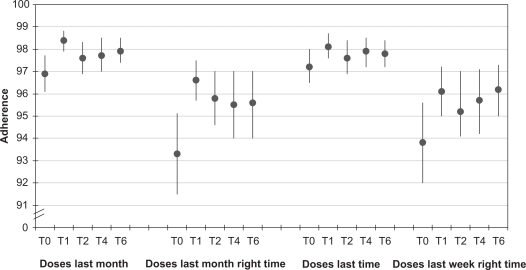
Figure 1.
Self-reported adherence rates at different time points (T expressed in months) according to the specific recall periods and eventual dosing timing.
Notes: The Y axis represents the indication on the VAS scale and can be regarded as a percentage. Data are expressed as means and 95% confidence intervals.

