Figure 4.
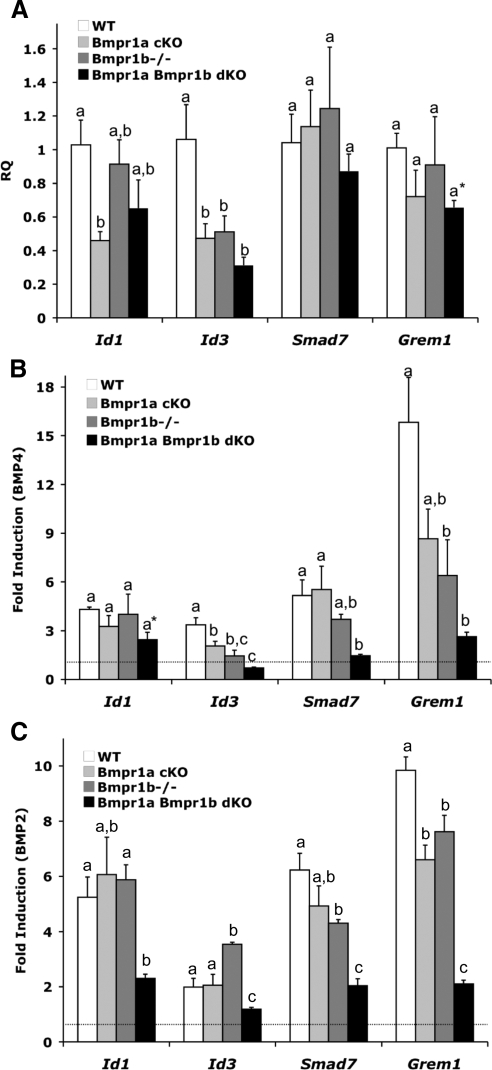
Relative expression of BMP target genes in WT, Bmpr1a cKO, Bmpr1b−/−, and Bmpr1a Bmpr1b dKO granulosa cells. Immature female mice (n = 4 for each genotype and at least three independent experiments) were primed with PMSG and granulosa cells were collected and cultured in the absence or presence of BMP4 (30 ng/ml) for 5 h. A, QPCR analysis of BMP target gene expression in untreated granulosa cells (RQ, relative quantity of transcript); B, QPCR analysis of gene expression changes after 5 h BMP4 treatment; C, QPCR analysis of gene expression changes after 5 h BMP2 treatment. Values are means ± sem, relative to values for the WT group. Data were analyzed using one-way ANOVA and Tukey's honestly significant differences test. Bars with a different letter (a–c) are significantly different at P < 0.05. Asterisks denote statistical significance by two-tailed Student's t test relative to WT granulosa cells: *, P ≤ 0.01.

