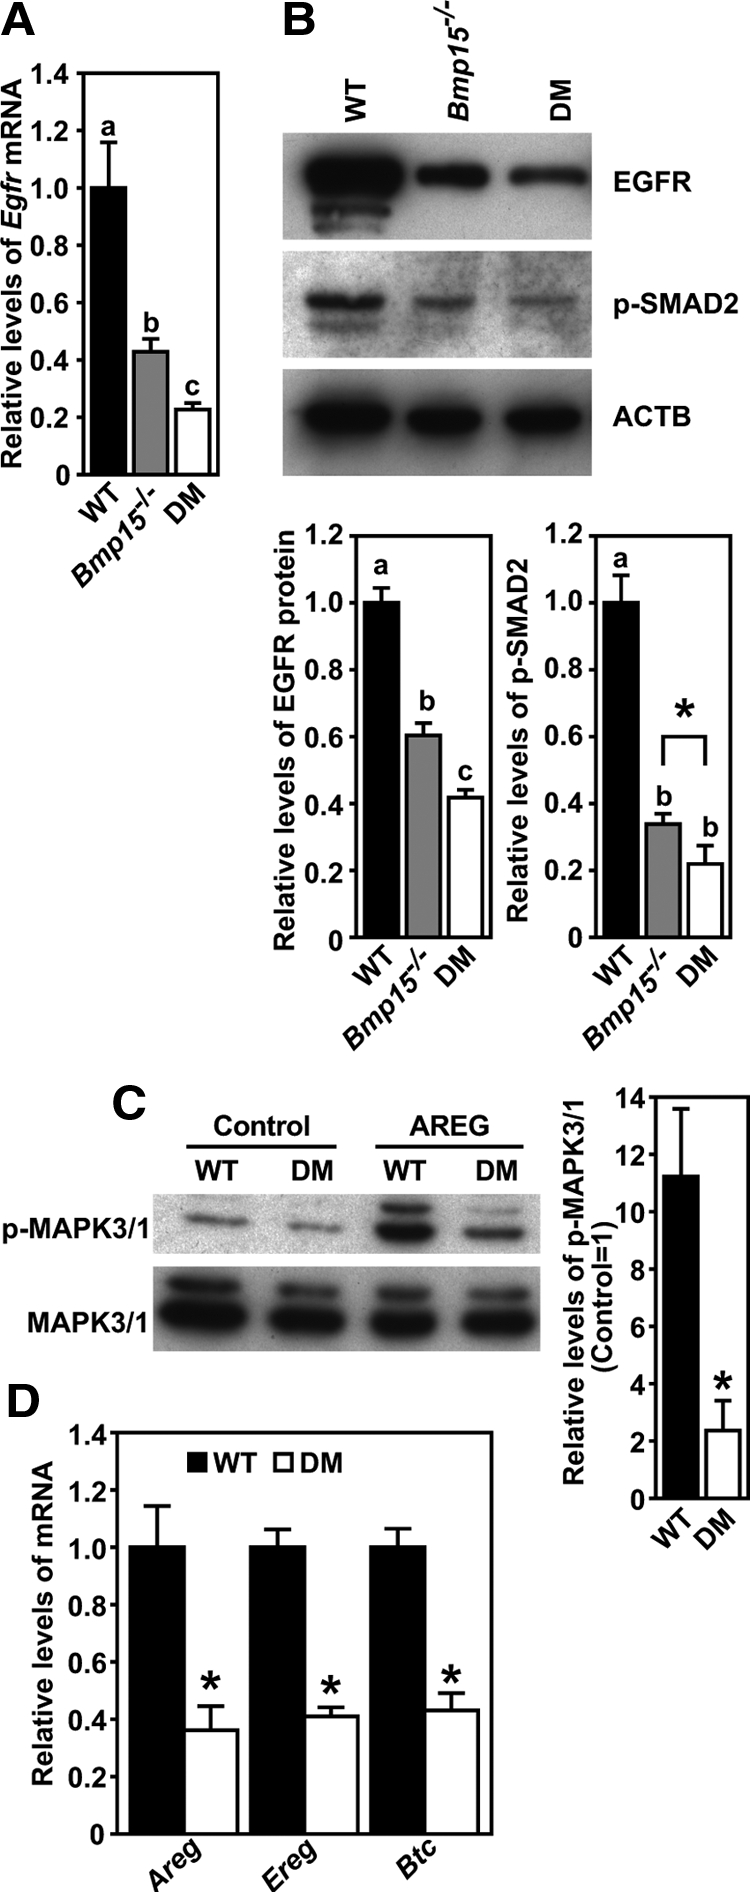
Figure 1.

Impaired EGFR signaling in cumulus cells freshly isolated from eCG-primed Bmp15−/− and DM mice. A, Real-time RT-PCR quantification of Egfr mRNA expressed in WT-, Bmp15−/−- and DM cumulus cells. B, Western blot analysis of EGFR, phosphorylated SMAD2 (p-SMAD2), and β-actin (ACTB) in WT-, Bmp15−/−-, and DM cumulus cells. *, P < 0.05, t test. C, EGFR-dependent acute response of WT- and DM-cumulus cells. Freshly isolated WT- and DM-COCs were treated with or without 250 ng/ml AREG for 30 min, indicated as “AREG” and “Control” groups, respectively, and the levels of p-MAPK3/1 and total MAPK3/1 were then assayed. D, Quantification of Areg, Ereg, and Btc mRNA in WT- and DM-cumulus cells 4 h after hCG injection in vivo. Levels of each transcript are presented as relative to WT. In all panels, groups indicated with different letters are significantly different, P < 0.05. In C and D, groups denoted with asterisks are significantly different from the corresponding WT groups, P < 0.05, t test. Note that each Western blot image shown is of the same membrane sequentially immunoblotted for the proteins indicated. This applies to all the following figures.
