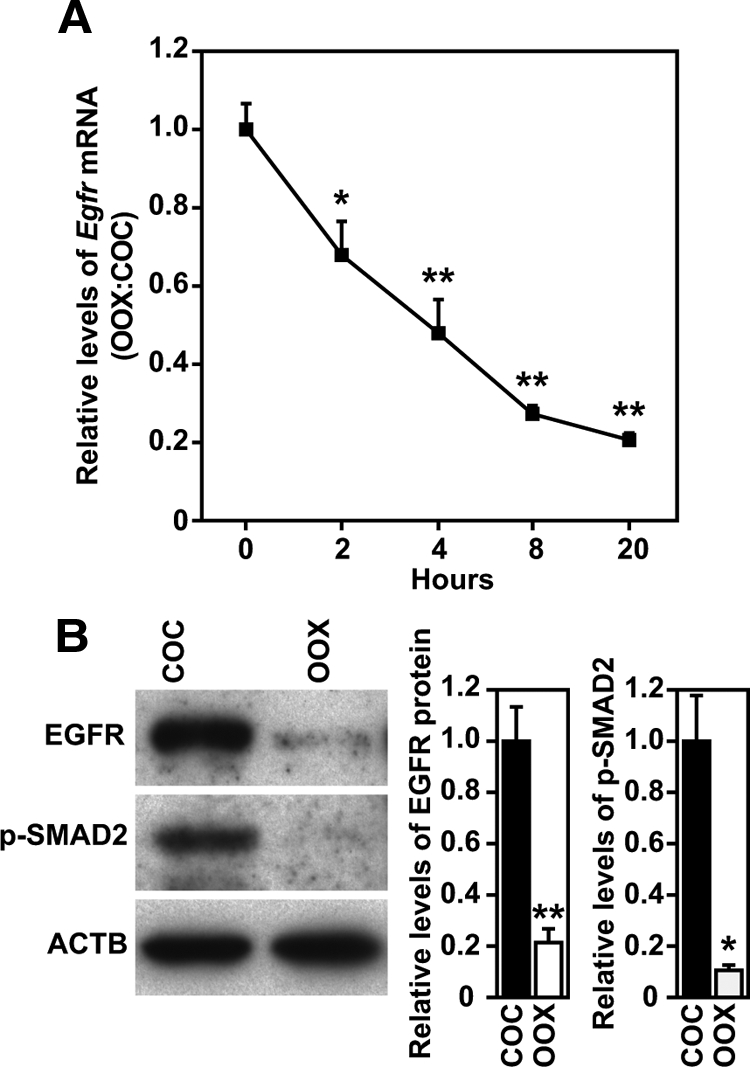
Figure 2.

Reduction of Egfr expression and levels of p-SMAD2 in WT OOX-cumulus cells. A, Changes of Egfr mRNA expressed in WT COCs and OOX cumulus cells during 20-h culture period. Levels of Egfr mRNA are presented as the ratio of OOX cumulus cells to COCs. *, P < 0.05; **, P < 0.01, compared with 0-h group by t test. B, Western blot analysis of EGFR, p-SMAD2, and β-actin (ACTB) in WT COCs and OOX cumulus cells 20 h after culture. *, P < 0.05; **, P < 0.01, compared with COC group by t test.
