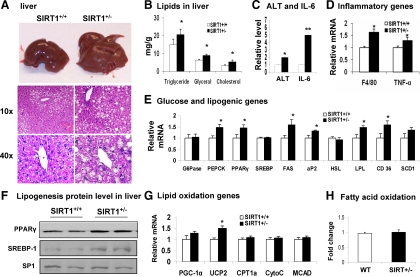
Figure 2.
Hepatic steatosis in SIRT1+/− mice on MFD. Liver was examined in mice of 28 wk of age on MFD. A, Liver. Tissue was stained with H&E. Pictures were taken using a microscopy with ×10 or ×40 object lenses, respectively. B, TAG, glycerol, and cholesterol content in the liver of mice. C, ALT and IL-6 levels in the serum. D, Inflammatory gene mRNA in liver. E, Gluconeogenic and lipogenic gene expression in liver. F, Western blot of PPARγ and SREBP-1 protein in nucleus of liver. G, β-Oxidation and mitochondrial genes. H, Fatty acid oxidation in liver tissue. Fold change is used to express mRNA expression. Values are the means ± se (n = 7). *, P ≤ 0.05; **, P ≤ 0.001.

