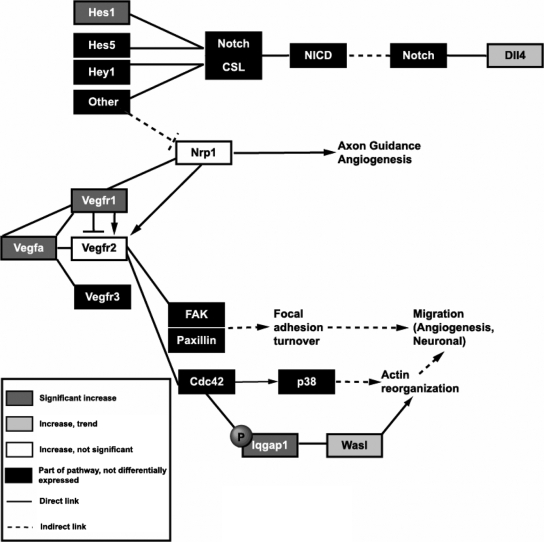
Figure 2.
Simplified schematic representation of VEGF and Notch signaling cascades showing genes with expression change on the microarray and validated by quantitative RT-PCR. Genes whose increased expression predicted by the microarray analysis was validated by quantitative RT-PCR are represented by dark gray boxes. Light gray boxes denote genes whose increase predicted by microarray analysis approached statistical significance in quantitative RT-PCR assays. Nrp1, represented by a white box, displayed the same direction of change predicted by microarray analysis but did not reach statistical significance. Vegfr2 was not predicted to increase by microarray analysis but was chosen because of the importance of this gene in VEGF signaling. This gene is also denoted by a white box, indicating that the observed increase in expression of this gene was not statistically significant. Black boxes represent other genes that are part of the pathway but not predicted to change with loss of Meg3 by microarray analysis. Solid lines refer to direct interactions and/or effects, and dashed lines refer to indirect action. Arrows denote activation, and perpendicular lines denote repression. FAK, Focal adhesion kinase; Cdc42, cell division control protein 42 homolog; Hey1, Hes-related with YRPW motif 1; CSL, notch-activated coactivator complex of CBF1/Su(H)/Lag2; NICD, Notch intracellular domain.

