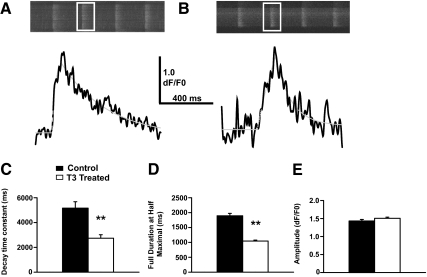
Figure 3.
Acceleration of decay kinetics in spontaneous Ca2+ waves indicates increased SERCA2a function in T3-treated HL-1 cells. Spontaneous Ca2+ waves in HL-1 cells that were either treated with T3 (1 μm) or vehicle control for 72 h were analyzed for their kinetic properties. A, Representative images of the fluo-4 fluorescent signal from control Hl-1 cells (top panels) with a trace (bottom panels, black line) of the mean fluorescent signal from the white boxed area. The trace data presented has been smoothed by a fast Fourier transform filter (4 point). A gray dashed line shows the function used to fit the fluorescence signal trace for analysis of kinetic properties. B, Same as in A for T3-treated HL-1 cells. C, T3 treatment (open bar) resulted in a decrease in the decay time constant (DTC) of Ca2+ waves when compared with a vehicle control (black bars). This suggests that Ca2+ clearance from the cytosol was accelerated due to T3 treatment, which is consistent with an increase of SERCA2a activity, resulting in increased uptake of Ca2+ into the sarcoplasmic reticulum. D, T3-treated cells also displayed a decreased duration of individual Ca2+ waves, which is also consistent with accelerated Ca2+ clearance for the cytosol due to elevated SERCA2a activity. E, The amplitude of individual Ca2+ waves in T3-treated cells was not significantly altered from those of vehicle-treated cells. Therefore, it is not likely that the alterations to the kinetics of the Ca2+ waves is due to alterations in the Ca2+ release machinery of, Ca2+ storage within the sarcoplasmic reticulum. Data are presented as mean ± sem. Statistical significance is determined by t test (**, P < 0.01).

