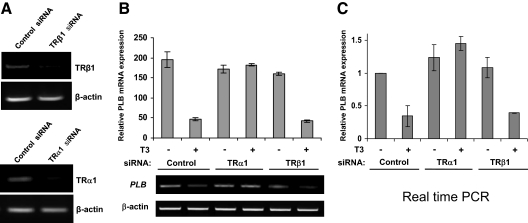
Figure 4.
Loss of TRα1 expression abolishes T3-dependent repression of PLB gene expression. A, HL-1 cells were electroporated with siRNA specific for either TRα1 or TRβ1 or with a nonspecific control siRNA. Total RNA was then extracted and assayed by semiquantitative RT-PCR using primers specific for TRα1, TRβ1, or β-actin. B and C, HL-1 cells were electroporated with siRNA specific for either TRα1 or TRβ1 or with a nonspecific control siRNA. The cells were then cultured with or without T3 (1 μm) for an additional 24 h. Total RNA was then extracted and analyzed by RT-PCR for PLB mRNA expression semiquantitatively (B) or in real time (C). Error bars represent the ±sd calculated from three separate experiments. In C, T3-untreated controls were set at 1. Quantitation and graphical representation were as outlined in the Fig. 2 legend.

