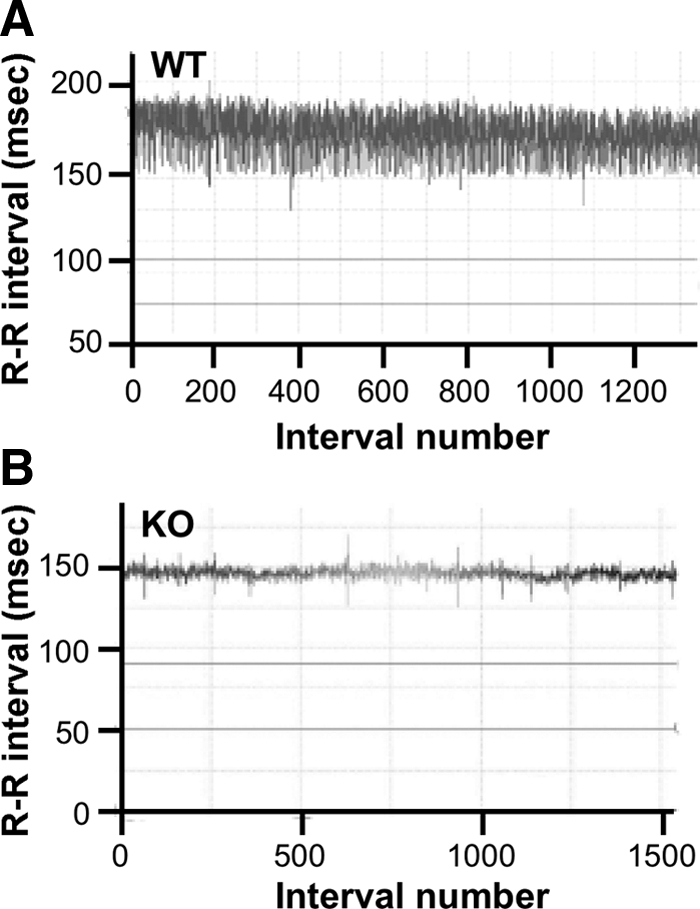
Figure 3.

Cardiac rate tachogram in (A) WT and (B) KO mice. The abscissa (x-axis) shows beat number (x, x + 1, x + 2, … , x + n), whereas the ordinate (y-axis) shows the R-R intervals (in msec) of consecutive beats: y1 = (x + 1) − x, y2 = (x + 2) − (x + 1), … , yn = (xn) − (xn − 1).
