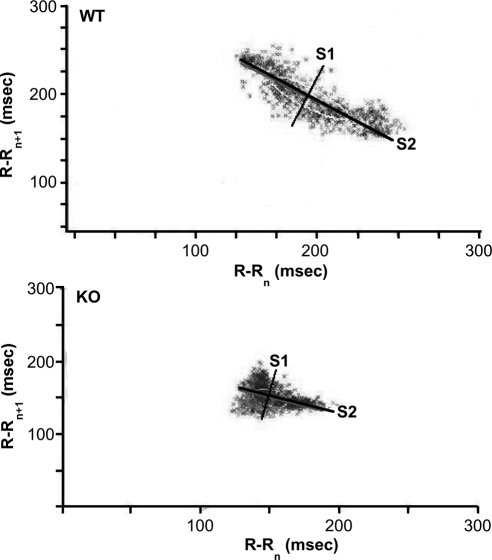
Figure 5.
Return maps. Typical representations of Lorenz return maps acquired from WT (top) and KO (bottom) mice. Plotted on abscissa is (R-Rn) against next (R-Rn+1) interval time on the ordinate. KO mice distinctly revealed a compact nature of point dispersion (i.e. narrow HRV) compared with the increased dimension of point's area in the WT mice. Ellipses have two perpendicular axes: long (S2) and short (S1).

