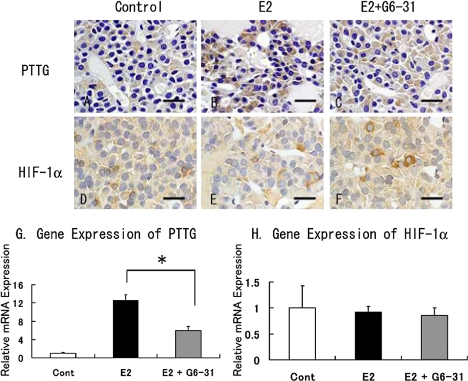
Fig. 6.
Immunohistochemistry of pituitary PRLoma in F344 rats. Staining of PTTG (A to C) and HIF-1α (D to F). Counterstaining was done with hematoxylin. Bar=20 µm. G and H: Gene expression of PTTG (G) and HIF-1α (H) in pituitary PRLoma in F344 rats. The columns show the mean value of the relative expression of PTTG and HIF-1α compared with GAPDH as an endogenous control. *: P<0.05, E2 versus E2+G6-31 group.

