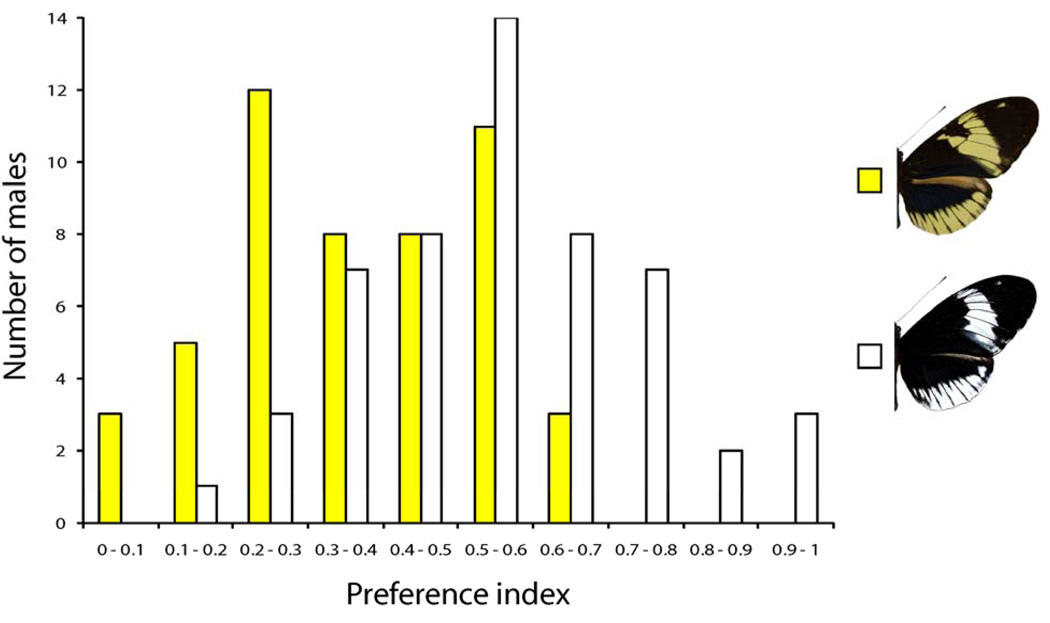
Fig. 2.
Distribution of H. cydno alithea mate preference indices for yellow (yellow bars, maximum likelihood estimate = 0.36 [0.423 − 0.299]) and white (white bars, maximum likelihood estimate = 0.54 [0.604 − 0.475]) males. The preference index (x-axis) is the proportion of courtship and attempted mating events that were directed toward white females; a preference index of 1 indicates complete preference for white whereas 0 indicates complete preference for yellow. All males with two or more courtship events are shown.

