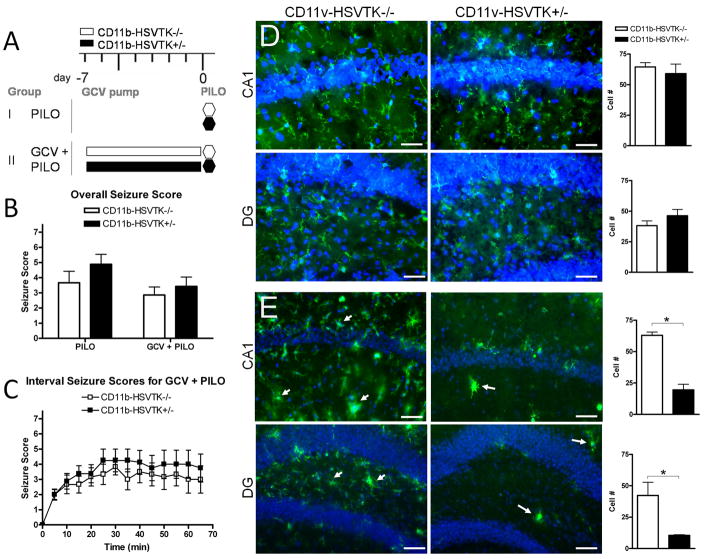
Figure 1. Quiescent hippocampal microglia do not modulate seizure threshold.
A) Schematic of experimental design in group I: PILO (pilocarpine only) and II: GCV + PILO (gancyclovir [GCV] infusion before pilocarpine) representing each genotype, white bars are CD11b-HSVK−/− (wild type mice lacking the transgene) and black bars are CD11b-HSVTK+/− (transgenic mice susceptible to microglia ablation by GCV). Administration of pilocarpine (280 mg/kg i.p.) is denoted by a hexagon at day 0 (and is always preceded 15–30 min by methylscopolamine, 2 mg/kg i.p.). Infusion of GCV (for 7 days) is denoted by the rectangular bars from day −7 to 0. B) Following pilocarpine injection, seizure symptoms were continuously recorded, the maximum score during each 5 minute interval was listed over the 60 minute observation period for each animal and averaged by genotype and group providing the overall seizure score. C) The maximum score during each 5 min interval was plotted over time, data points represent the average score ± S.E.M. for each set of animals. D–E) Tissue was collected 2 hours post seizure induction and stained with Iba1 (green fluorescence) for microglia/macrophages. Iba1 is upregulated in activated cells. CA1 and hilar region of the dentate gyrus (DG) are shown with nuclei (DAPI). Panels in D represent group I, and E group II. Arrows in E indicate activated microglia/macrophages. To the right of each set of panels is quantification of Iba1+ cell number counted at 40× in regions of interest (ROIs) sized 300×400μm2 for each group (scale bar 50 μm, two-way ANOVA, Bonferroni post tests, * = p<0.05, data in all graphs plotted as average ± S.E.M.).

