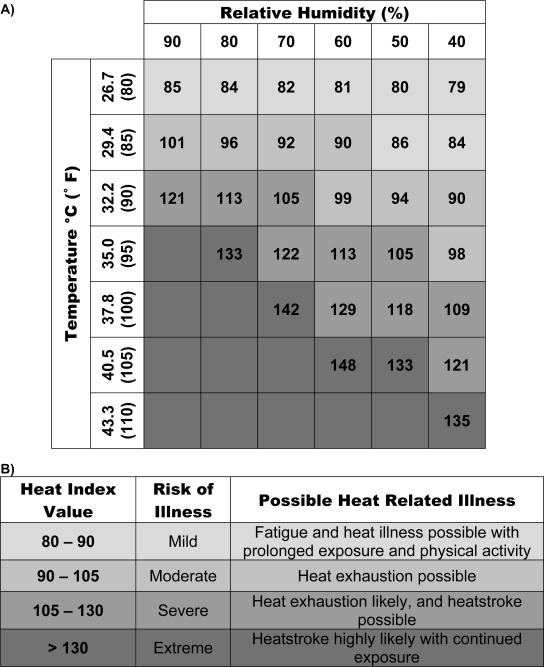
Figure 3.
Example of heat illness risk assessment charts. A) Heat index value is determined from temperature (°C) versus relative humidity (%). B) The risk of heat illness is estimated from the heat index value.
Note: The values for heat index are based upon shady, light wind conditions. Exposure to direct sunlight can increase the heat index by up to 9°C (15°F). Information adapted from http://www.crh.noaa.gov/pub/heat.php.

