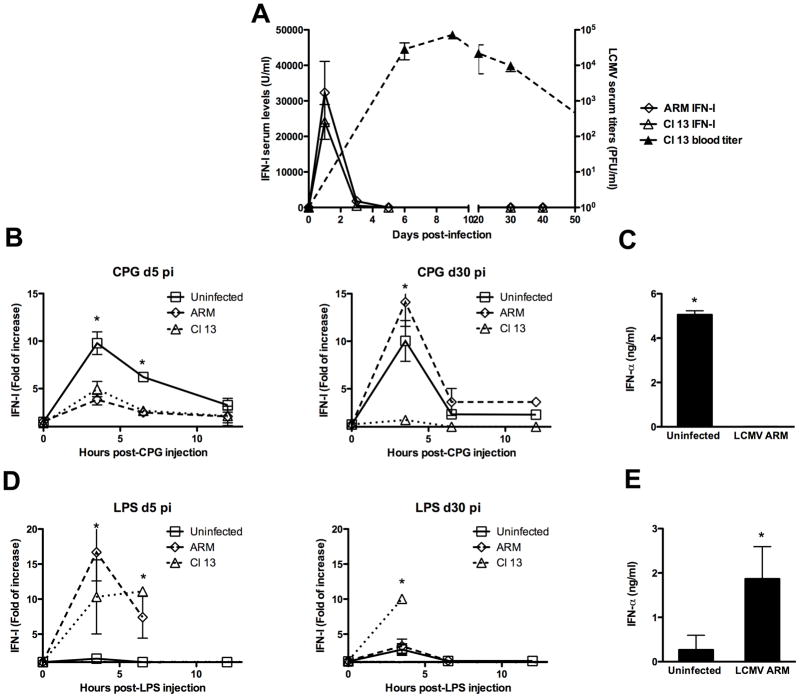
Figure 1. Systemic IFN-I response during LCMV infection.
Mice were infected iv with 2 × 10⁶ PFU of ARM or Cl 13 LCMV. Eye-bleed samples were collected before infection (day 0) and at 1, 3, 5, 30 and 40 days pi. IFN-I activity was measured by luciferase bioassay (left y axis) and LCMV titer by plaque assay (right y axis) (A). Uninfected ARM- and Cl 13-infected mice at day 5 or 30 pi were injected with 5 μg of CpG (B–C) or LPS (D–E). Blood samples were collected before injection (0 h) and at 3.5, 6.5 and 12 h post-stimulation. IFN-I activity was measured by luciferase bioassay and the fold of increase respect to levels at 0 h is shown (B and D). ELISA was used to quantify IFN-α in samples collected at 3.5 h after stimulation from day-5 ARM infected mice (C and E). The mean ± s. d. obtained with 3 to 4 mice per group is shown (* LCMV-infected compared to uninfected group p<0.01). Data are representative of two to eight independent experiments.

