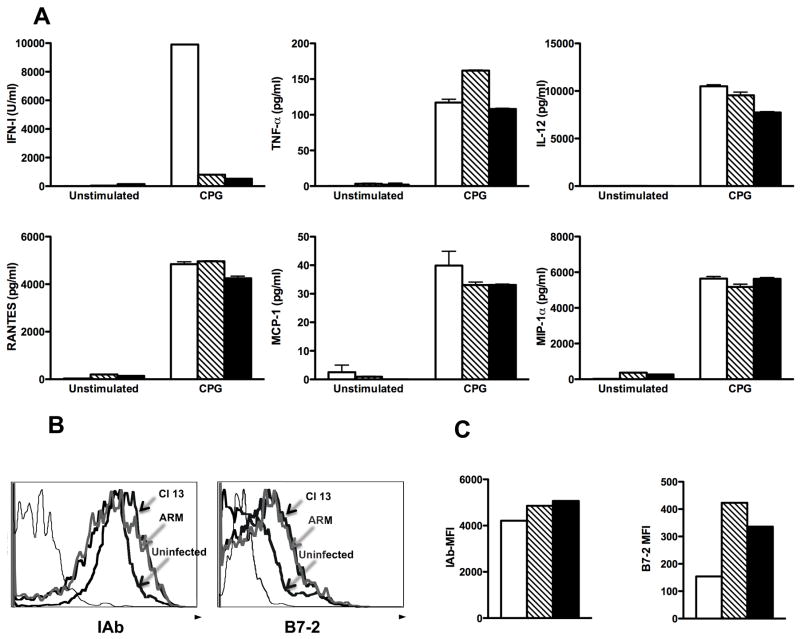
Figure 3. Characterization of pDC-TLR response during LCMV infection.
Spleen pDCs (5 × 10⁵ cells/ml) were FACS–purified as CD11c+B220+120G8highCD11b−CD3−NK1.1−CD19− from uninfected (n=3, white bars), ARM (n=10, striped bars) or Cl 13 (n=10, black bars) infected mice at day 5 pi. Cells were cultured with medium alone (none) or CpG-1668 during 15 h. A) IFN-I activity was measured in the supernatant by luciferase bioassay, other cytokines and chemokines indicated were determined by multi-plex ELISA. (B and C) CPG-stimulated pDCs were stained with anti-IAb and anti B7-2 mAbs and analyzed by FACS. B) Histrograms depict expression of the indicated molecules. Thin line, unstained control. C) Mean fluorescence intensity (MFI) for each molecule is shown.

