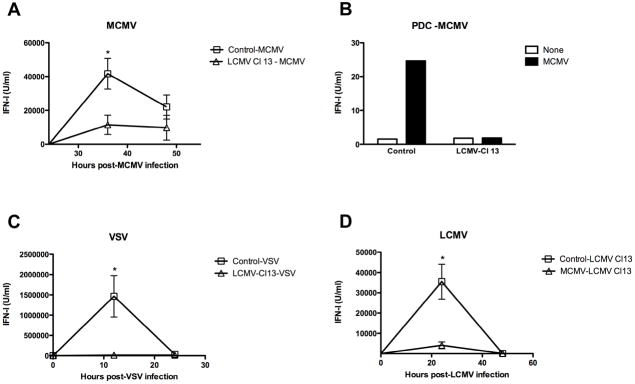
Figure 5. IFN-I production upon secondary viral infections.
Uninfected and LCMV Cl 13 infected mice (day 20–30 pi) were injected with MCMV (A and B) or with VSV (C). In D uninfected or MCMV-infected mice (day 2.5 pi) were injected with LCMV Cl 13. (A, C and D) Blood samples were collected at the indicated times after secondary infection (indicated on top of each graph) and IFN-I activity was measured by luciferase bioassay. The mean obtained from 6 mice per group is shown. (* dual viral infection compared to single viral infection p<0.01). Results are representative from 1 or 2 independent experiments. B) FACS–purified spleen pDCs were pooled from 4 mice per group and cultured with medium alone. Levels of IFN-I were measured in the supernatants at 15 h post-culture. Results are representative of 3 independent experiments.

