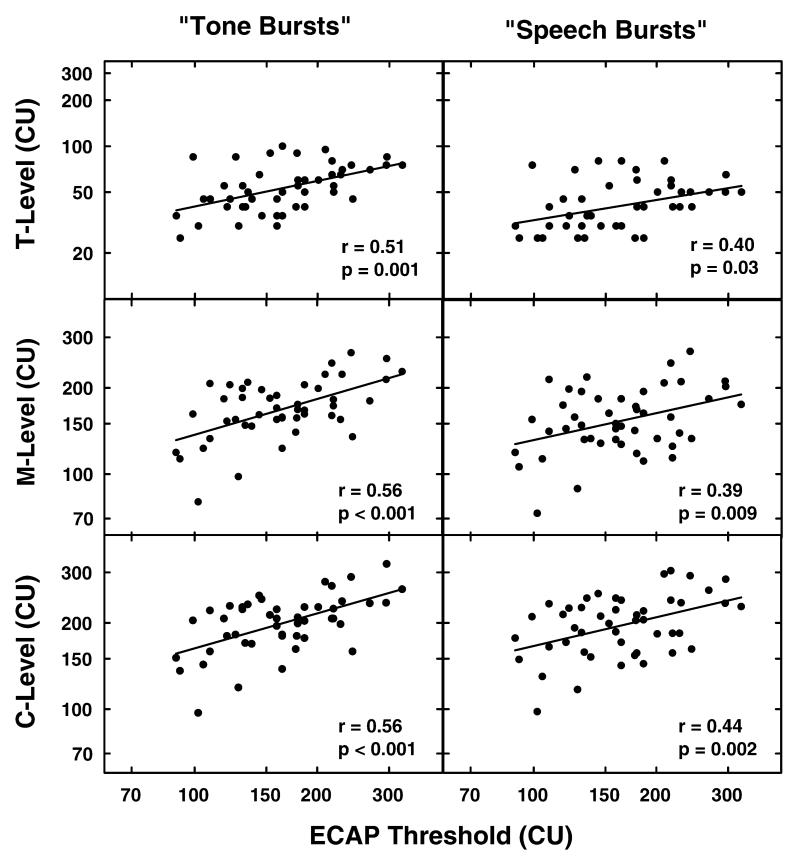
Figure 2.
ECAP thresholds determined using the visual detection paradigm are compared with the behavioral measures of T-, M-, and C-level. In the three graphs on the left, ECAP threshold is compared with T-, M-, and C-levels obtained using a tone burst stimulus. In the three graphs on the right, ECAP threshold is compared with T-, M-, and C-levels obtained using a speech burst stimulus. Stimulation level is specified in clinical programming units (CUs).

